1
Please refer to important disclosures at the end of this report
1
1
Rossari Biotech is one of the leading specialty chemicals manufacturing
companies in India providing customized solutions to specific industrial and
production requirements of the customers. It caters to the FMCG, apparel, and
poultry & animal feed industries which contributed 46.8%, 43.7% and 9.5%
respectively to F.Y.20 revenue.
Positives: (1) It is the largest textile specialty chemical manufacturer in India. (2) It
has experienced promoters along with strong management team. (3) Company
also has proven track record of robust financial performance. (4) Surge in home,
personal care and performance chemicals (sanitizers, cleaning products) demand
due to covid-19. (5) Doubling of capacity to 252,500 MTPA by F.Y.21 end from
120,000 MTPA as on F.Y.20 end. Post the increase in capacity, Company will
have to incur just maintenance capital expenditure for the next 3-4 years.
(6) Only 10% of sales are dependent on imported raw material, of which less
than 5% comes from China.
Investment concerns: (1) Slowdown in demand especially from textile industry. (2)
Revenue is dependent on top 5 customers which contributed 43.9% of revenue for
F.Y.19-20. (3) Delay in addition of new capacity or lower utilization ratio of new
capacity to be added than expectation (4) Company is not able to maintain its
ROE, ROCE, working capital days and EBIDTA margins.
Outlook & Valuation: At the upper end of the price band, Rossari demands PE
multiple of 32.1x F.Y.20 fully diluted EPS. None of the listed chemical companies
has the same business as Rossari. Its specialty chemical peers such as Galaxy
Surfactants, Fine Organics, Aarti industries, Atul and Vinati Organics are currently
trading at F.Y.2020 P/E multiples of 24.0x, 36.6x, 30.5x, 20.6x and 30.9x
respectively. We believe Rossari will command premium over most of its chemical
peers as it is net debt free as well as it has better asset turnover, working capital
days, ROE and ROCE better than most of its peers. In the last three years Rossari
have reported 32% and 66% revenue and PAT CAGR due to the strong promoter
and management team. As we are positive on the future outlook for the industry
as well as the company, we would recommend to “Subscribe” to the issue.
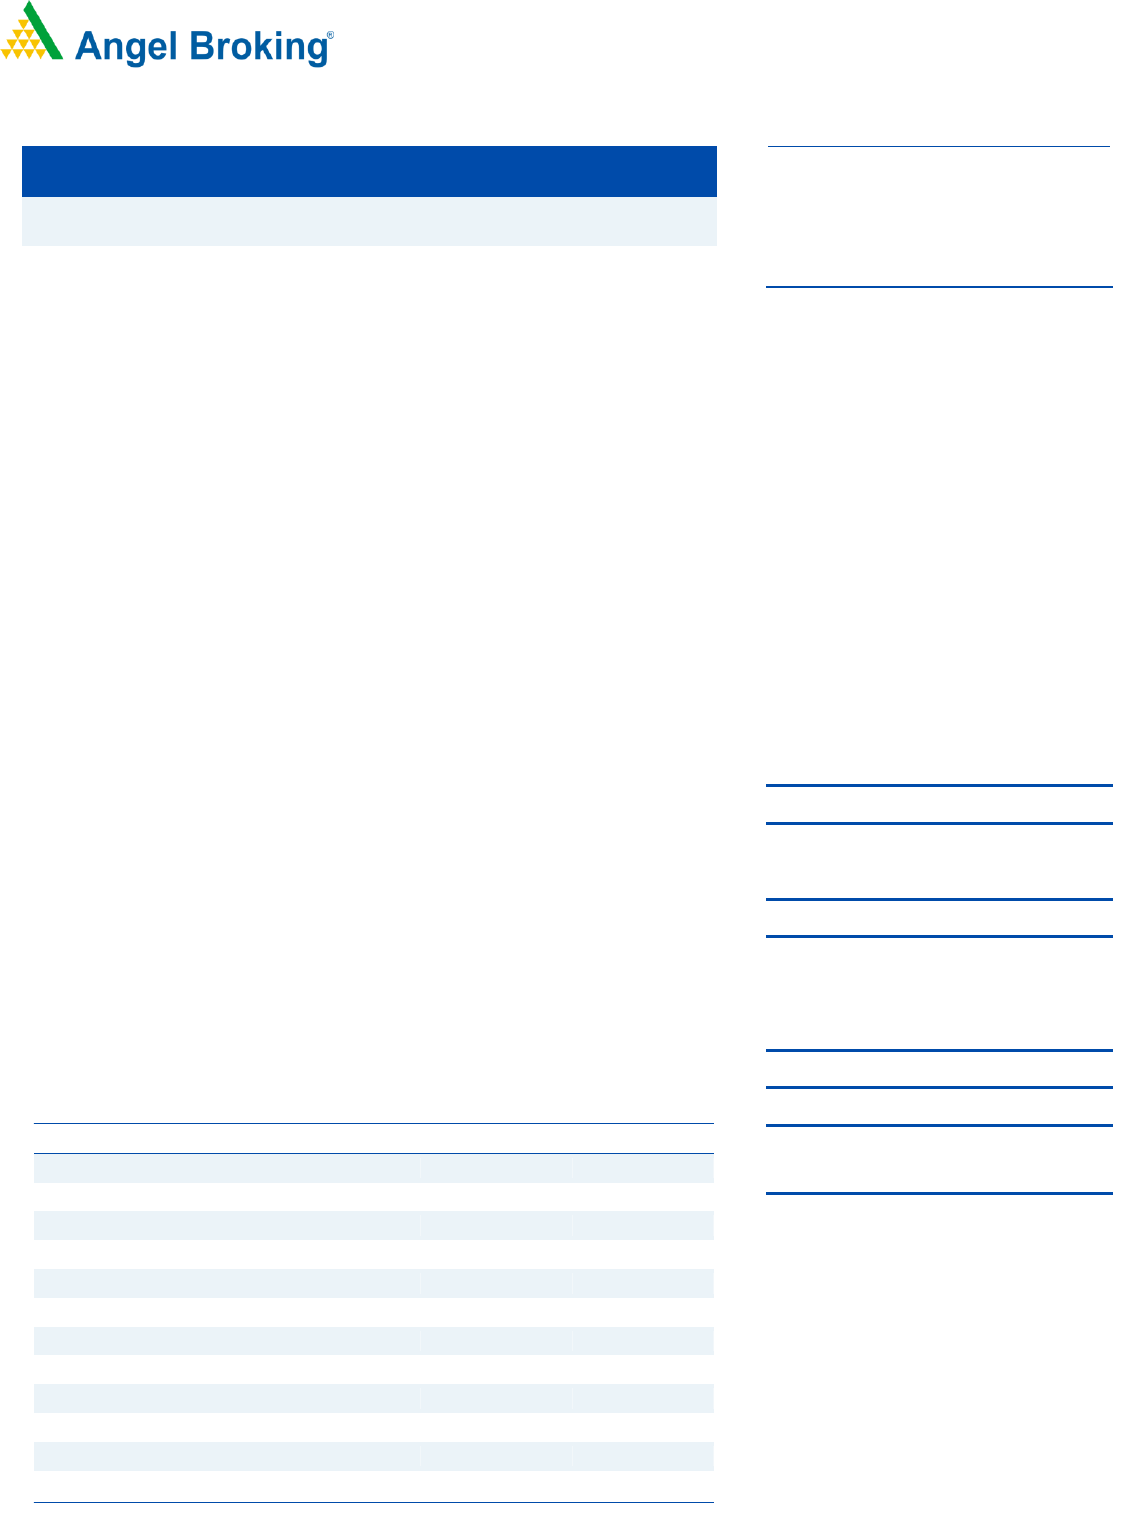
Key Financials
Y/E March (` cr)
FY18
FY19
FY20
Net Sales
299.1
516.2
600.1
% chg
15.3
72.6
16.2
Net Profit
25.4
45.7
65.3
% chg
77.6
79.7
42.9
EBITDA (%)
14.3
15.0
17.5
EPS (Rs)
5.3
9.4
13.4
P/E (x)
81.0
45.0
32.1
P/BV (x)
23.6
16.6
7.2
RoE (%)
34.1
43.3
31.8
RoCE (%)
35.0
51.2
25.3
EV/EBITDA
48.7
26.5
20.0
EV/Sales
6.9
4.0
3.5
Company Source: RHP, Angel Research; Note: valuation ratios based at upper price band
SUBSCRIBE
Issue Open: July 13, 2020
Issue Close: July 15, 2020
QIBs 50% of issue
Non-Institutional 15% of issue
Retail 35% of issue
Promoters 73%
Others 27%
Post Issue Shareholding Pattern
Post Eq. Paid up Capital: `10.4cr
Issue size (amt): *`494.2 -**`496.3cr
Price Band: `423-425
Post-issue implied mkt. cap: *`2,197cr
-**`2,207cr
Promoters holding Pre-Issue: 95.1%
Promoters holding Post-Issue: 72.7%
*Calculated on lower price band
** Calculated on upper price band
Book B uilding
Lot Size: 35 shares and in multiple
thereafter
Fresh issue: `50 cr
Face Value: `2
Present Eq. Paid up Capital: `10.2cr
Offer for Sale: **1.05 cr Shares
Rossari Biotech
IPO Note | Chemicals
July 10, 2020

2
July
10,
2020
Rossari Biotech | IPO Note
July 10, 2020
2
Company background
Rossari Biotech was started in C.Y.03 as “Rosssari Labtech”, a partnership firm
having Mr. Edward Menezes and Mr. Sunil Chari as partners. It was converted to
Company in C.Y.09 by Mr. Edward Menezes and Mr. Chari. It has PAN India
presence through 206 distributors and across 17 countries through 29 distributors
as on January 31, 2020. It has focused R&D capabilities built around customer
requirements and sustainable products & processes.
Product Segment
Home, personal care and performance chemicals
Rossari is the leading manufacturer of acrylic polymers in India (Source: F&S
Report) and currently manufacture over 300 products for the customers in the
soaps and detergent, paints, inks and coatings, ceramics and tiles, water treatment
chemicals and pulp and paper industries. Company also manufacture institutional
cleaning chemical formulations for hospitality, facility management, airports,
corporates, food service, commercial laundry, malls, multiplexes, educational
sector, places of worship etc. Company are in advanced stages of expanding their
home, personal care and performance product portfolio to water treatment
formulations, specialty formulation for breweries as well as dairies. Company
primarily operates in a business-to-business model. Major customers are RSPL
(Ghadi detergent), IFB Industries, HUL, Panasonic India, CICO Technologies and
Millennium Papers.
Textile specialty chemicals
Company provide specialty chemicals for the entire value-chain of the textile
industry starting from fiber, yarn to fabric, wet processing and garment processing
and as on May 31, 2020, manufactures and sales approximately 1,543 products
for the customers in this product category. Company focus on providing
eco-friendly sustainable chemical solutions to the customers which either replaces
the highly polluting chemicals being used by the customers or reduces the impact
of environmental pollution by suitably modifying the overall industrial process.
Major Customers are Arvind, Raymond, Ashnoor Textile and Bhaskar Industies.
Animal health and nutrition
Company have also diversified into animal health and nutrition and currently
supply poultry feed supplements and additives, pet grooming and pet treats
including for weaning, infants and adult pets and currently manufactures over 100
products for the customers in this category. Major customers are Hitech Hatch
Fresh, Gokul Poultry Industries and Sneha Farms.
3
July
10,
2020
Rossari Biotech | IPO Note
July 10, 2020
3
Business Update: Covid-19
Revenue during the last 10 days during Mar’20 was lost on account of the
lockdown. However, from Apr’20 onwards the plant utilization picked up to
50% -55% and is expected to reach 75%-80% in Jul-20.
The Company is experiencing robust recovery from Jun’20 onwards. Revenue
during Jun’20 is expected to surpass the average monthly revenue of F.Y.20.
Manufacturing facility was operational during the lockdown period albeit with
lower capacity due to logistics, labor and demand constraints.
Demand in the Home, Personal Care and Performance Chemicals witnessed a
surge in demand given the focus on hygiene products like sanitizers,
disinfectants, hand washes and other cleaning products.
Commencement of phase-1 of Dahej plant in Jul’20 of the planned expansion
of capacity by 132,500 MTPA and plant to be fully operational by end of the
fiscal year.
Issue Details
Rossari is raising `50cr through fresh issue & selling 1.05 cr equity shares through
offer for sale in the price band of `423-425.
Pre & Post IPO Shareholding Pattern
No of shares
(Pre-issue)
%
(Post-issue)
%
Promoter
48,245,500
95.1
37,745,500
72.7
Public
2,507,420
4.9
14,183,891
27.3
Total
50,752,920
100
51,929,391
100
Source: RHP, Angel Research.
Note: Calculated on upper price band
Objects of the offer
`65cr for repayment/prepayment of debt including accrued interest, `50cr for
working capital requirements and balance for general corporate purposes.
Key Management Personnel
Mr. Edward Menezes, is the Executive Chairman of the Company. He was a
founder of the Company and has been a member of the Board since incorporation
of the Company. He holds a bachelor’s degree in science (chemistry major) from
K. J. Somaiya College of Science, University of Bombay and a bachelor’s degree
of science (technology) in textile chemistry from University Department of Chemical
Technology (UDCT), University of Bombay. He has over 25 years of experience in
the specialty chemicals industry.
Mr. Sunil Chari, is the Managing Director of the Company. He was also a founder
of the Company and has been a member of our Board since incorporation of the
Company. He holds a bachelor’s degree in arts from the Kakatiya University. He
also holds a diploma in technical and applied chemistry from Victoria Jubilee
Technical Institute (VJTI). He has over 20 years of experience in the specialty
chemicals industry.

4
July
10,
2020
Rossari Biotech | IPO Note
July 10, 2020
4
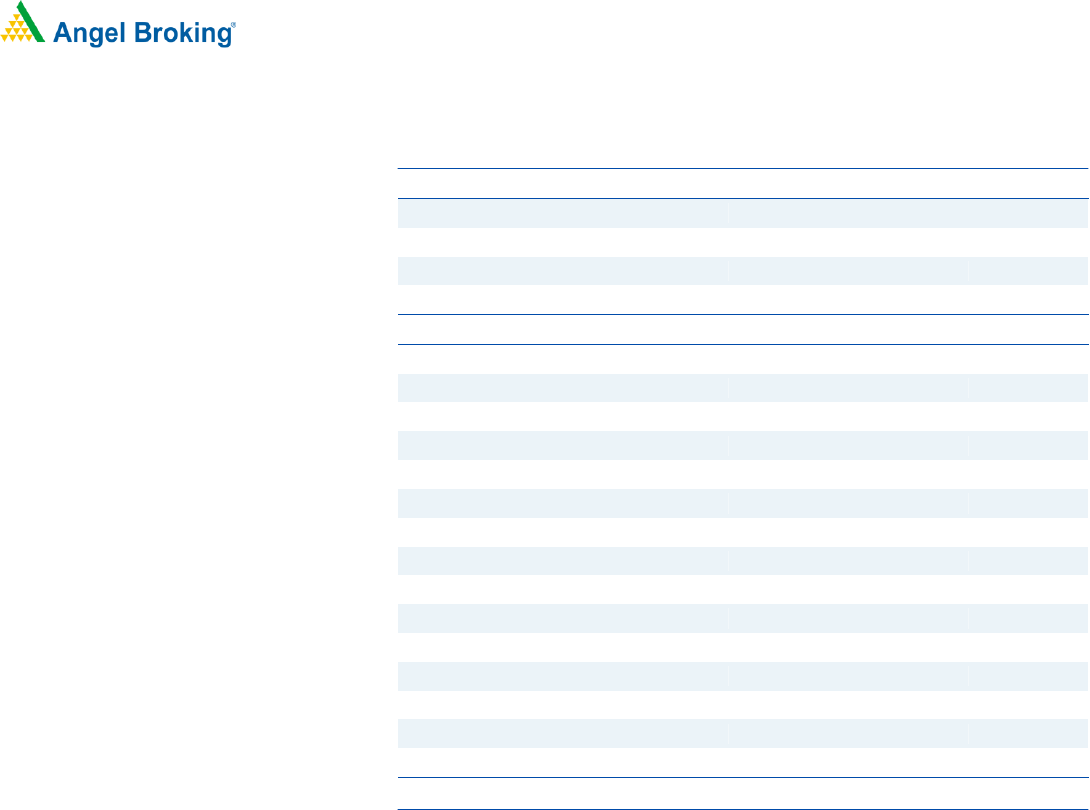
Peer Comparision F.Y.20
Particulars
PE
P/BV
ROE %
EBIDTA margin %
Rossari Biotech
32.1
7.2
31.8
17.5
Aarti Industries
30.5
5.3
23.3
21.7
Vinati Organics
30.9
8.1
30.6
39.7
Atul
20.6
0.9
17.4
22.0
Galaxy Surfactants
24.0
5.2
24.1
15.7
Fine organics
36.6
9.9
30.4
23.1
Source: Company, Angel Research
Note: Valuation ratios based on closing price as on July 10, 2020
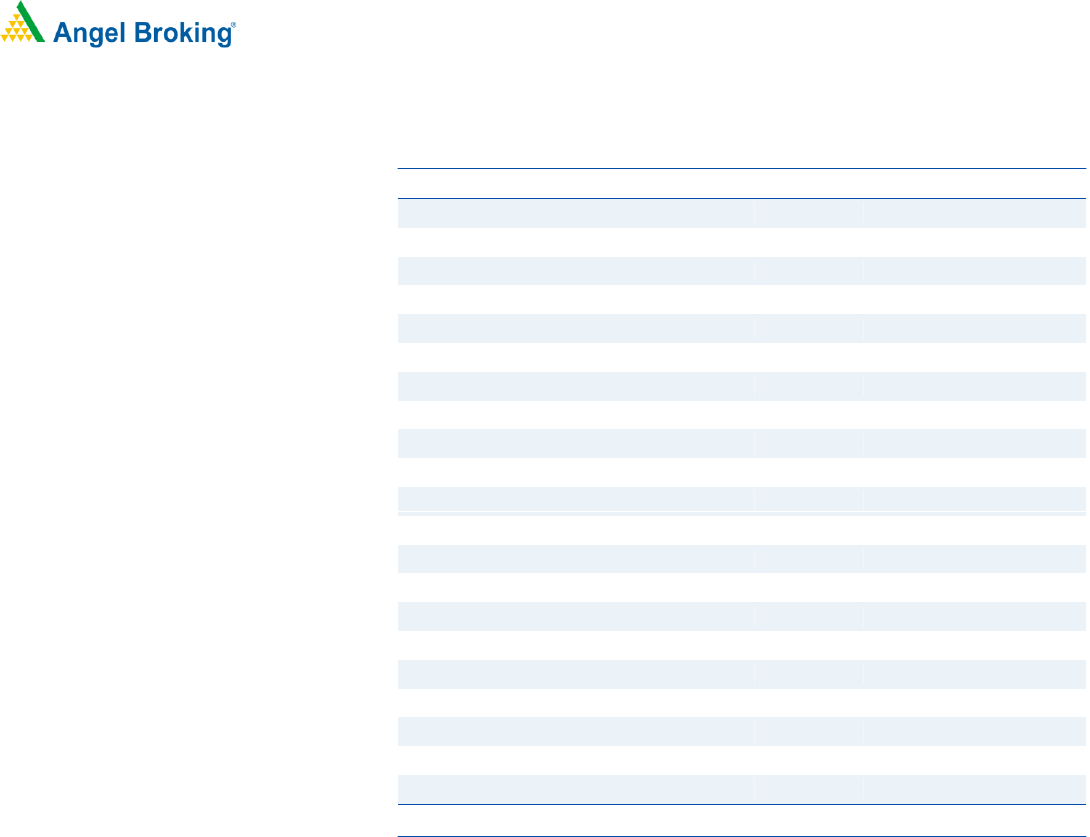
Consolidated Income Statement
Y/E March (` cr)
FY18
FY19
FY20
Total operating income
299.1
516.2
600.1
% chg
-
72.6
16.2
Total Expenditure
256.4
438.6
495.3
Cost of materials, stores & spare parts
196.6
355.2
369.3
Change in inventories
1.1
-16.0
2.4
Excise duty
6.9
-
-
Employee Benefit Expense
19.8
27.5
37.2
Other Expenses
32.1
71.8
86.4
EBITDA
42.7
77.6
104.8
% chg
-
82.0
34.9
(% of Net Sales)
14.3
15.0
17.5
Depreciation& Amortisation
5.2
12.3
16.9
EBIT
37.5
65.4
87.9
% chg
-
74.4
34.5
(% of Net Sales)
12.5
12.7
14.6
Interest & other Charges
1.4
2.9
3.6
Other Income
1.4
0.9
3.7
(% of Sales)
0.5
0.2
0.6
Recurring PBT
37.5
63.4
88.1
% chg
-
69.1
38.9
Share of loss of joint venture
-
-
-0.2
Tax
-12.1
-17.7
-22.6
PAT (reported)
25.4
45.7
65.3
% chg
-
79.7
42.9
(% of Net Sales)
8.5
8.9
10.9
Basic & Fully Diluted EPS (Rs)
5.3
9.4
13.2
% chg
-
79.8
40.1
Source: Company, Angel Research
5
July
10,
2020
Rossari Biotech | IPO Note
July 10, 2020
5
Consolidated Balance Sheet
Y/E March (` cr)
FY18
FY19
FY20
SOURCES OF FUNDS
Equity Share Capital
4.4
4.4
10.2
Other equity
82.7
119.4
276.5
Shareholders Funds
87.1
123.8
286.7
Total Loans
20.1
3.9
61.0
Other liabities
3.3
3.6
2.2
Total Liabilities
110.5
131.3
349.8
APPLICATION OF FUNDS
Net Block
43.8
74.0
86.5
Right of use of assets
7.2
7.1
7.0
Capital Work-in-Progress
2.4
2.8
21.8
Current Assets
109.9
159.8
326.3
Inventories
34.6
54.9
58.2
Investments
6.9
-
13.7
Sundry Debtors
61.6
85.9
94.1
Cash & Bank Balance
1.0
6.0
127.2
Other Assets
5.9
12.9
33.1
Current liabilities
54.5
118.5
121.7
Net Current Assets
55.5
41.2
204.7
Other Non Current Asset
1.7
6.2
29.9
Total Assets
110.5
131.3
349.8
Source: Company, Angel Research
6
July
10,
2020
Rossari Biotech | IPO Note
July 10, 2020
6
Consolidated Cash Flow Statement
Y/E March (` cr)
FY18
FY19
FY20
Profit before tax
37.5
63.4
88.1
Depreciation
5.2
12.3
16.9
Change in Working Capital
(9.9)
11.4
(31.1)
Interest Expense
1.4
2.9
3.6
Direct Tax Paid
(8.3)
(20.4)
(20.1)
Others
(0.2)
1.6
(2.4)
Cash Flow from Operations
25.6
71.2
54.8
(Inc.)/ Dec. in Fixed Assets
(20.8)
(37.1)
(89.7)
Investment in JV
-
-
(4.4)
Others
0.4
0.6
(96.2)
Cash Flow from Investing
(20.4)
(36.4)
(190.3)
Interest paid
(1.4)
(2.1)
(3.3)
Borrowings
(4.9)
(15.7)
64.0
Loan from related parties
-
(0.7)
(1.2)
Dividend paid on equity shares
(0.3)
(10.6)
(2.6)
Issue of Share capital
-
-
0.5
Share Premium received
-
-
99.5
Cash Flow from Financing
(6.5)
(29.2)
156.9
Inc./(Dec.) in Cash
(1.4)
5.6
21.5
Opening Cash balances
2.1
0.6
5.7
Effect of exchange rates
(0.1)
(0.5)
2.0
Closing Cash balances
0.6
5.7
29.2
Source: Company, Angel Research
7
July
10,
2020
Rossari Biotech | IPO Note
July 10, 2020
7
Key Ratios
Y/E March
FY18
FY19
FY20
Valuation Ratio (x)
P/E (on FDEPS)
81.0
45.0
32.1
P/CEPS
64.6
35.6
25.4
P/BV
23.6
16.6
7.2
EV/Sales
6.9
4.0
3.5
EV/EBITDA
48.7
26.5
20.0
Per Share Data (Rs)
EPS (Basic)
5.3
9.4
13.4
EPS (fully diluted)
5.3
9.4
13.2
Cash EPS
6.6
11.9
16.7
Book Value
18.0
25.6
59.2
Returns (%)
Angel ROIC (Pre tax)
38.7
55.0
47.5
ROE
34.1
43.3
31.8
ROCE
35.0
51.2
25.3
Turnover ratios (x)
Asset Turnover
6.8
7.0
6.9
Inventory / Sales (days)
42.2
38.8
35.4
Receivables (days)
75.1
60.8
57.3
Payables (days)
53.6
74.9
59.0
Working capital cycle (days)
63.7
24.6
33.6
Source: Company, Angel Research

8
July
10,
2020
Rossari Biotech | IPO Note
July 10, 2020
8
Research Team Tel: 022 - 39357800 E-mail: [email protected] Website: www.angelbroking.com
DISCLAIMER
Angel Broking Limited (hereinafter referred to as “Angel”) is a registered Member of National Stock Exchange of India Limited, Bombay
Stock Exchange Limited, Metropolitan Stock Exchange Limited, Multi Commodity Exchange of India Ltd and National Commodity &
Derivatives Exchange Ltd It is also registered as a Depository Participant with CDSL and Portfolio Manager and Investment Adviser with
SEBI. It also has registration with AMFI as a Mutual Fund Distributor. Angel Broking Limited is a registered entity with SEBI for Research
Analyst in terms of SEBI (Research Analyst) Regulations, 2014 vide registration number INH000000164. Angel or its associates has not
been debarred/ suspended by SEBI or any other regulatory authority for accessing /dealing in securities Market. Angel or its
associates/analyst has not received any compensation / managed or co-managed public offering of securities of the company covered
by Analyst during the past twelve months.
This document is solely for the personal information of the recipient, and must not be singularly used as the basis of any investment
decision. Nothing in this document should be construed as investment or financial advice. Each recipient of this document should make
such investigations as they deem necessary to arrive at an independent evaluation of an investment in the securities of the companies
referred to in this document (including the merits and risks involved), and should consult their own advisors to determine the merits and
risks of such an investment.
Reports based on technical and derivative analysis center on studying charts of a stock's price movement, outstanding positions and
trading volume, as opposed to focusing on a company's fundamentals and, as such, may not match with a report on a company's
fundamentals. Investors are advised to refer the Fundamental and Technical Research Reports available on our website to evaluate the
contrary view, if any
The information in this document has been printed on the basis of publicly available information, internal data and other reliable
sources believed to be true, but we do not represent that it is accurate or complete and it should not be relied on as such, as this
document is for general guidance only. Angel Broking Limited or any of its affiliates/ group companies shall not be in any way
responsible for any loss or damage that may arise to any person from any inadvertent error in the information contained in this report.
Angel Broking Limited has not independently verified all the information contained within this document. Accordingly, we cannot testify,
nor make any representation or warranty, express or implied, to the accuracy, contents or data contained within this document. While
Angel Broking Limited endeavors to update on a reasonable basis the information discussed in this material, there may be regulatory,
compliance, or other reasons that prevent us from doing so.
This document is being supplied to you solely for your information, and its contents, information or data may not be reproduced,
redistributed or passed on, directly or indirectly.
Neither Angel Broking Limited, nor its directors, employees or affiliates shall be liable for any loss or damage that may arise from or in
connection with the use of this information.
